Cost Optimization Strategies in Azure Data Engineering
Where Azure data pipelines actually rack up cost, and practical ways to bring that cost down without breaking reliability or performance.
Why this matters more than it seems early on
When you are learning data engineering, cost is easy to ignore. You spin up a cluster, run a job, and move on. But once you are working on a real Azure environment with pipelines running daily against real data volumes, cost stops being an afterthought and starts becoming something you actually get asked about, sometimes directly by a manager looking at a monthly Azure bill that just doubled.
The good news is that most cost problems in Azure data engineering come from a small number of repeated mistakes, and once you know what to look for, they are usually straightforward to fix.
Compute is almost always the biggest cost
Storage on Azure is genuinely cheap. Azure Data Lake Storage Gen2 costs very little per gigabyte, even at large scale. The real cost usually comes from compute, meaning Databricks clusters and Synapse SQL pools running longer or bigger than they actually need to.
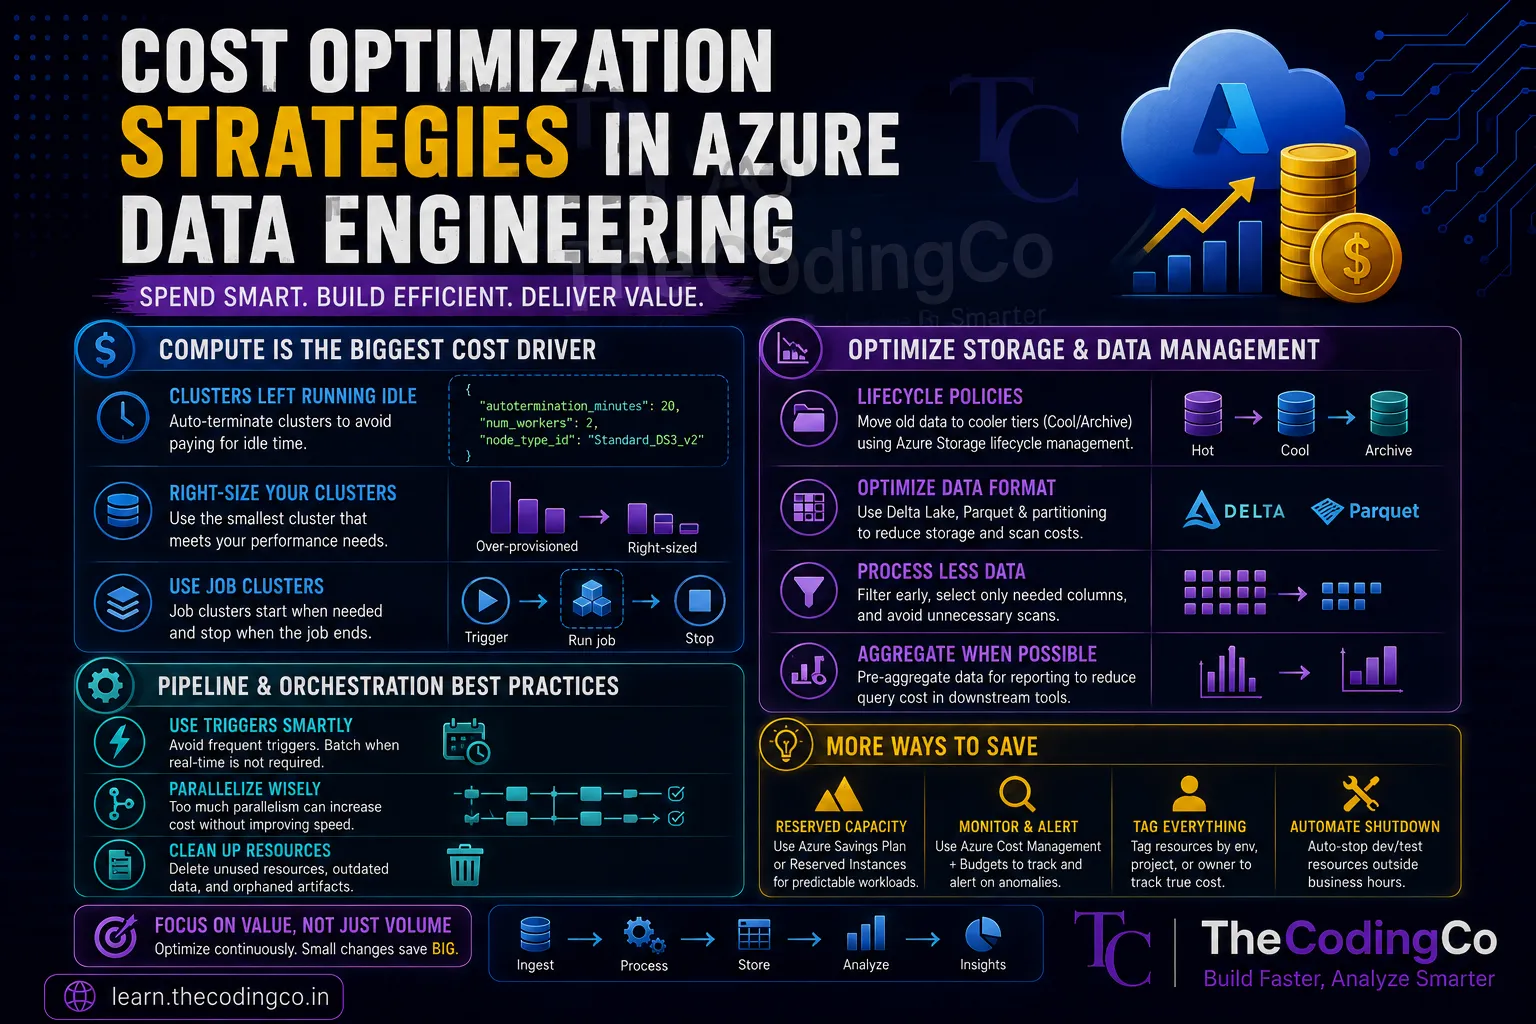
Clusters left running idle A surprisingly common issue is a Databricks cluster that gets spun up for a job, and then just sits there running after the job finishes, because auto termination was never configured. This alone can quietly become one of the largest line items on a bill.
# When creating a cluster, always set an auto termination value
# so it shuts down automatically after being idle
{
  "autotermination_minutes": 20,
  "num_workers": 2,
  "node_type_id": "Standard_DS3_v2"
}
Twenty minutes of idle time before shutdown is a common starting point, though the right number depends on how frequently the cluster gets reused throughout the day.
Oversized clusters for the actual workload It is common to see a cluster sized for a worst case scenario running every single day, even on days when the actual data volume is small. A cluster with eight worker nodes processing a dataset that would run fine on two nodes is just paying for compute that never gets used.
A practical habit here is checking actual cluster utilization through the Databricks cluster metrics after a job runs, and scaling down if CPU and memory usage never come close to fully using the allocated nodes.
Use job clusters instead of all purpose clusters for scheduled work
Databricks distinguishes between all purpose clusters, meant for interactive development where people are actively working in notebooks, and job clusters, which spin up specifically to run a scheduled job and terminate immediately afterward.
All purpose clusters are billed at a higher rate because they are meant to stay available for interactive use. If a scheduled production pipeline is still running on an all purpose cluster instead of a job cluster, that is often an easy, immediate cost reduction, since job clusters cost less per hour and shut down automatically the moment the job finishes.
Autoscaling, used correctly
Autoscaling lets a cluster grow and shrink the number of worker nodes based on actual load during a job, rather than staying fixed at a size chosen upfront. This helps avoid paying for a large fixed cluster the entire time a job runs, when maybe only a portion of that job actually needs that much compute.
{
  "autoscale": {
    "min_workers": 2,
    "max_workers": 8
  }
}
The part people get wrong here is setting the minimum too high just to be safe, which defeats a lot of the purpose. Setting a genuinely low minimum, and letting Azure scale up only when the workload actually demands it, tends to save more without hurting performance.
Storage tiering in ADLS Gen2
Not all data needs to sit in the most expensive storage tier. Azure Data Lake Storage Gen2 supports hot, cool, and archive tiers, and a lot of teams leave everything in the hot tier by default, even data that is rarely accessed after the first few weeks.
A common pattern is keeping recent data, say the last thirty to ninety days, in the hot tier for fast access, while older data that is mostly kept for historical or compliance reasons gets moved to the cool or archive tier, which costs significantly less per gigabyte.
# Lifecycle management policies in ADLS Gen2 can automate this,
# moving data to cool tier after a set number of days
{
  "rules": [
    {
      "name": "moveOldDataToCool",
      "definition": {
        "actions": {
          "baseBlob": {
            "tierToCool": { "daysAfterModificationGreaterThan": 90 }
          }
        }
      }
    }
  ]
}
This one is easy to overlook entirely, since it does not affect pipeline logic at all, just where the data physically sits.
Avoiding unnecessary data reprocessing
A less obvious cost driver is pipelines that reprocess far more data than necessary on every run. If a nightly job reads the entire history of a table every single night instead of just the new records since the last run, that cost grows every single day as the table gets bigger, even though the actual new data volume stays roughly the same.
Using incremental processing, where a pipeline only reads and processes new or changed records since the last successful run, keeps compute cost roughly flat over time instead of growing with total table size.
# Reading only new data since the last processed watermark,
# instead of reprocessing the entire table every run
last_processed_date = get_last_watermark()

df_incremental = spark.read.format("delta") \
    .load("/mnt/datalake/bronze/orders/") \
    .filter(f"order_date > '{last_processed_date}'")
This is one of those changes that does not show up as a problem right away, but becomes very visible in cost once a table grows large enough.
Synapse specific considerations
For Azure Synapse Dedicated SQL Pools, cost is tied directly to the Data Warehouse Units allocated, and that cost runs whether the pool is being actively queried or not, unless it is explicitly paused. A pool left running overnight or over a weekend when nobody is querying it is pure wasted cost.
Pausing a Synapse Dedicated SQL Pool during known periods of inactivity, and scaling down the DWU level for workloads that do not need peak performance around the clock, are both straightforward ways to cut cost without touching any pipeline logic.
A habit worth building early
The single most useful habit for cost awareness is actually looking at the Azure Cost Management dashboard periodically, filtered by resource, rather than only finding out about cost problems when someone else flags a spike. Seeing which specific Databricks workspace or Synapse pool is driving cost makes it much easier to trace a spike back to a specific pipeline or cluster configuration, rather than trying to guess after the fact.
Interview angle
If asked about cost optimization, naming specific mechanisms tends to land much better than a vague answer about being cost conscious. Mentioning auto termination on clusters, the difference between job clusters and all purpose clusters, autoscaling, storage tiering in ADLS Gen2, and incremental processing shows you understand where cost actually accumulates in a real Azure data pipeline, not just that cost exists as a concept.
Quick recap
Most cost issues in Azure data engineering trace back to compute, not storage. Leaving Databricks clusters running idle, using all purpose clusters for scheduled jobs instead of job clusters, oversizing clusters for the actual workload, and reprocessing entire tables instead of just new data are the most common and most fixable cost drivers. Combined with proper storage tiering in ADLS Gen2 and pausing unused Synapse Dedicated SQL Pools, these changes usually bring cost down significantly without touching pipeline reliability or performance.